Determination of Fluorescence Quantum Yield
The fluorescence quantum yield (ηfl; QY) is an important optical parameter of a fluorophore in addition to the spectral position of the fluorescence. The combination of extinction coefficient and quantum yield determines the signal intensity obtained when a dye is used as a fluorescent marker. The product of the extinction coefficient and the quantum yield is therefore called the "brightness" of a fluorophore.
The quantum yield depends intrinsically on the molecular structure of the dye, but is also influenced by numerous external factors. These include the temperature, viscosity, polarity and pH value of the environment. This environment can consist of molecules of the solvent itself or other jointly dissolved substances, but also of a coupled biomolecule or a cell membrane in whose immediate vicinity the fluorescent dye is located. By changing the fluorescence, conclusions can be drawn about certain properties of the environment: The fluorescent dye then acts as a molecular probe.
The fluorescence quantum yield is defined as the ratio of the number of photons (= light quanta) emitted as fluorescence and the number of photons previously absorbed by the sample:
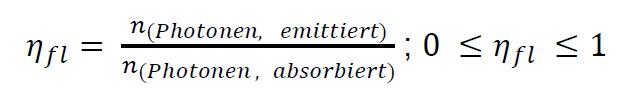
If all absorbed photons are emitted as fluorescence, a quantum yield of 1 or 100 % is obtained. However, radiation-free deactivation processes of the excited state always compete with the emission, so that part of the absorbed energy is released into the environment as heat.
Exactly this phenomenon is used for the absolute determination of the quantum yield using "calorimetric" methods such as the Thermal Blooming method. This requires relatively complicated experimental set-ups as well as a comprehensive theoretical understanding for the conception and evaluation of the measurements.
It is easier to determine the unknown quantum yield of a fluorophore (sample) by comparing it with the known quantum yield of a standard or reference dye (reference) in a fluorescence spectrometer. This so-called relative determination can be performed in different ways:
The statistical accuracy of the result increases with the number of comparison measurements performed.
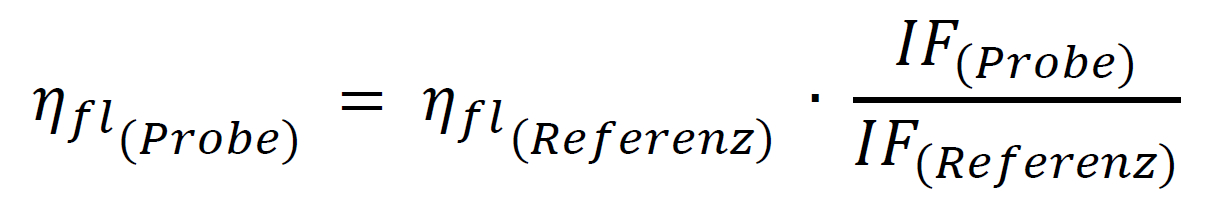
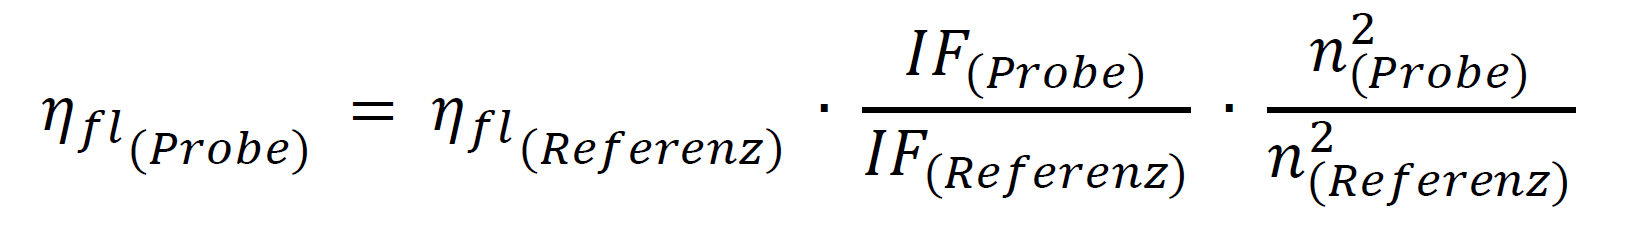
The theoretical prerequisite for the application of the relative method is that the two solutions of sample and reference to be compared have an identical absorption at the excitation wavelength and thus absorb the same number of photons. Then the quotient of the integrated fluorescence spectra (IF = area of the fluorescence band) of both solutions - registered under identical conditions - gives the ratio of the quantum yields of both dyes, so that the unknown quantum yield can easily be calculated:
The following example illustrates the importance to record the entire fluorescence spectrum - the integral fluorescence intensity - for the determination of the fluorescence quantum yield with this method:
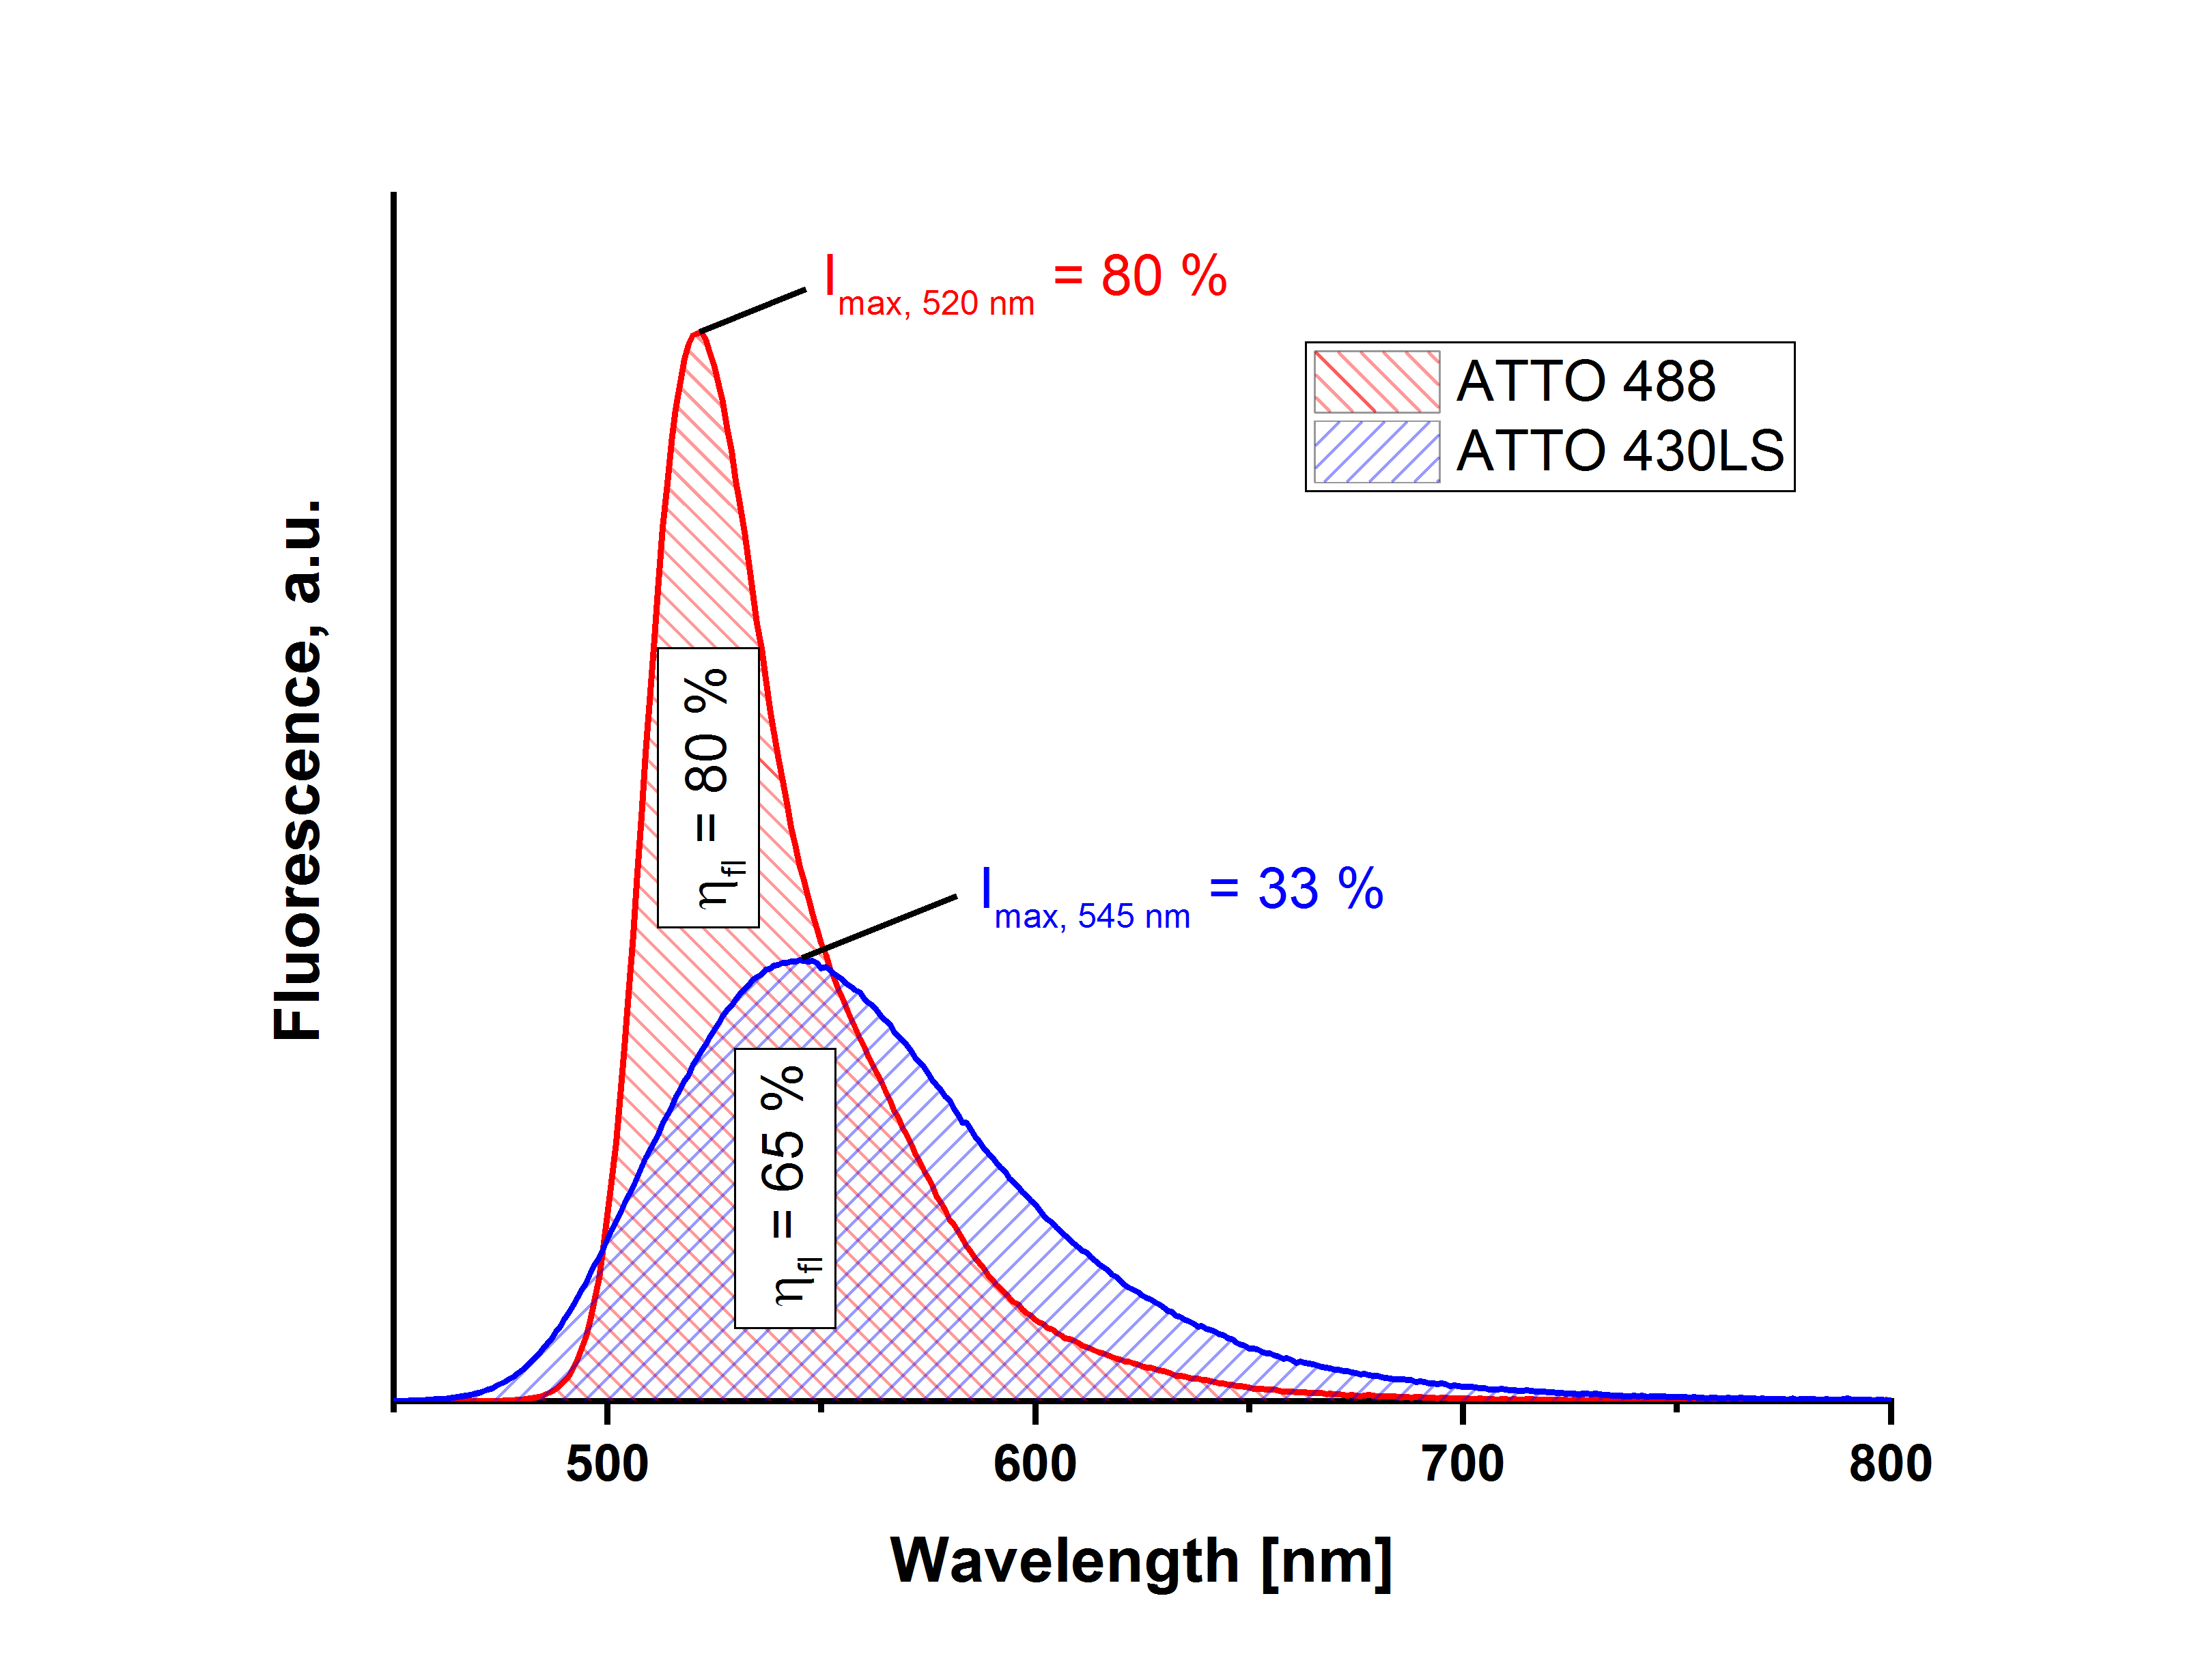
The dyes ATTO 488 carboxy and ATTO 430LS carboxy were both excited at the intersection of their absorption spectra and the emission of both solutions was measured. Comparative measurements with a standard (Rhodamin 6G) resulted in a fluorescence quantum yield of 80 % for ATTO 488 carboxy. With this, a value of 65 % is obtained for ATTO 430LS carboxy according to the described relative method. If only the intensity at the respective fluorescence maxima were taken into account, a value of 33 % for ATTO 430LS carboxy would be found compared to the known 80 % for ATTO 488 carboxy. This strong difference is due to the different spectral distribution of the fluorescence of the two dyes.
Identical conditions for recording the fluorescence spectra of sample and reference can be achieved from the instrument side by using the same measurement parameters. These include the geometry of the beam path (e.g. 90° or front face arrangement), detector gain, slit width (or bandpass) and the same excitation wavelength.
The excitation wavelength can, for example, be the intersection of the long-wave absorption bands of the sample and the reference. The absorption at the respective maximum of the dye band may then be slightly different.
This becomes clear with the example of ATTO 488 carboxy and ATTO 532 carboxy with slightly different absorbance at the individual absorption maxima: After recording absorption spectra of both measuring solutions, the intersection point (here 513.1 nm) at which both solutions have the same absorbance (here 0.0183) can be determined by superimposing the two spectra. (For small values extinction/absorbance and absorption are identical.)
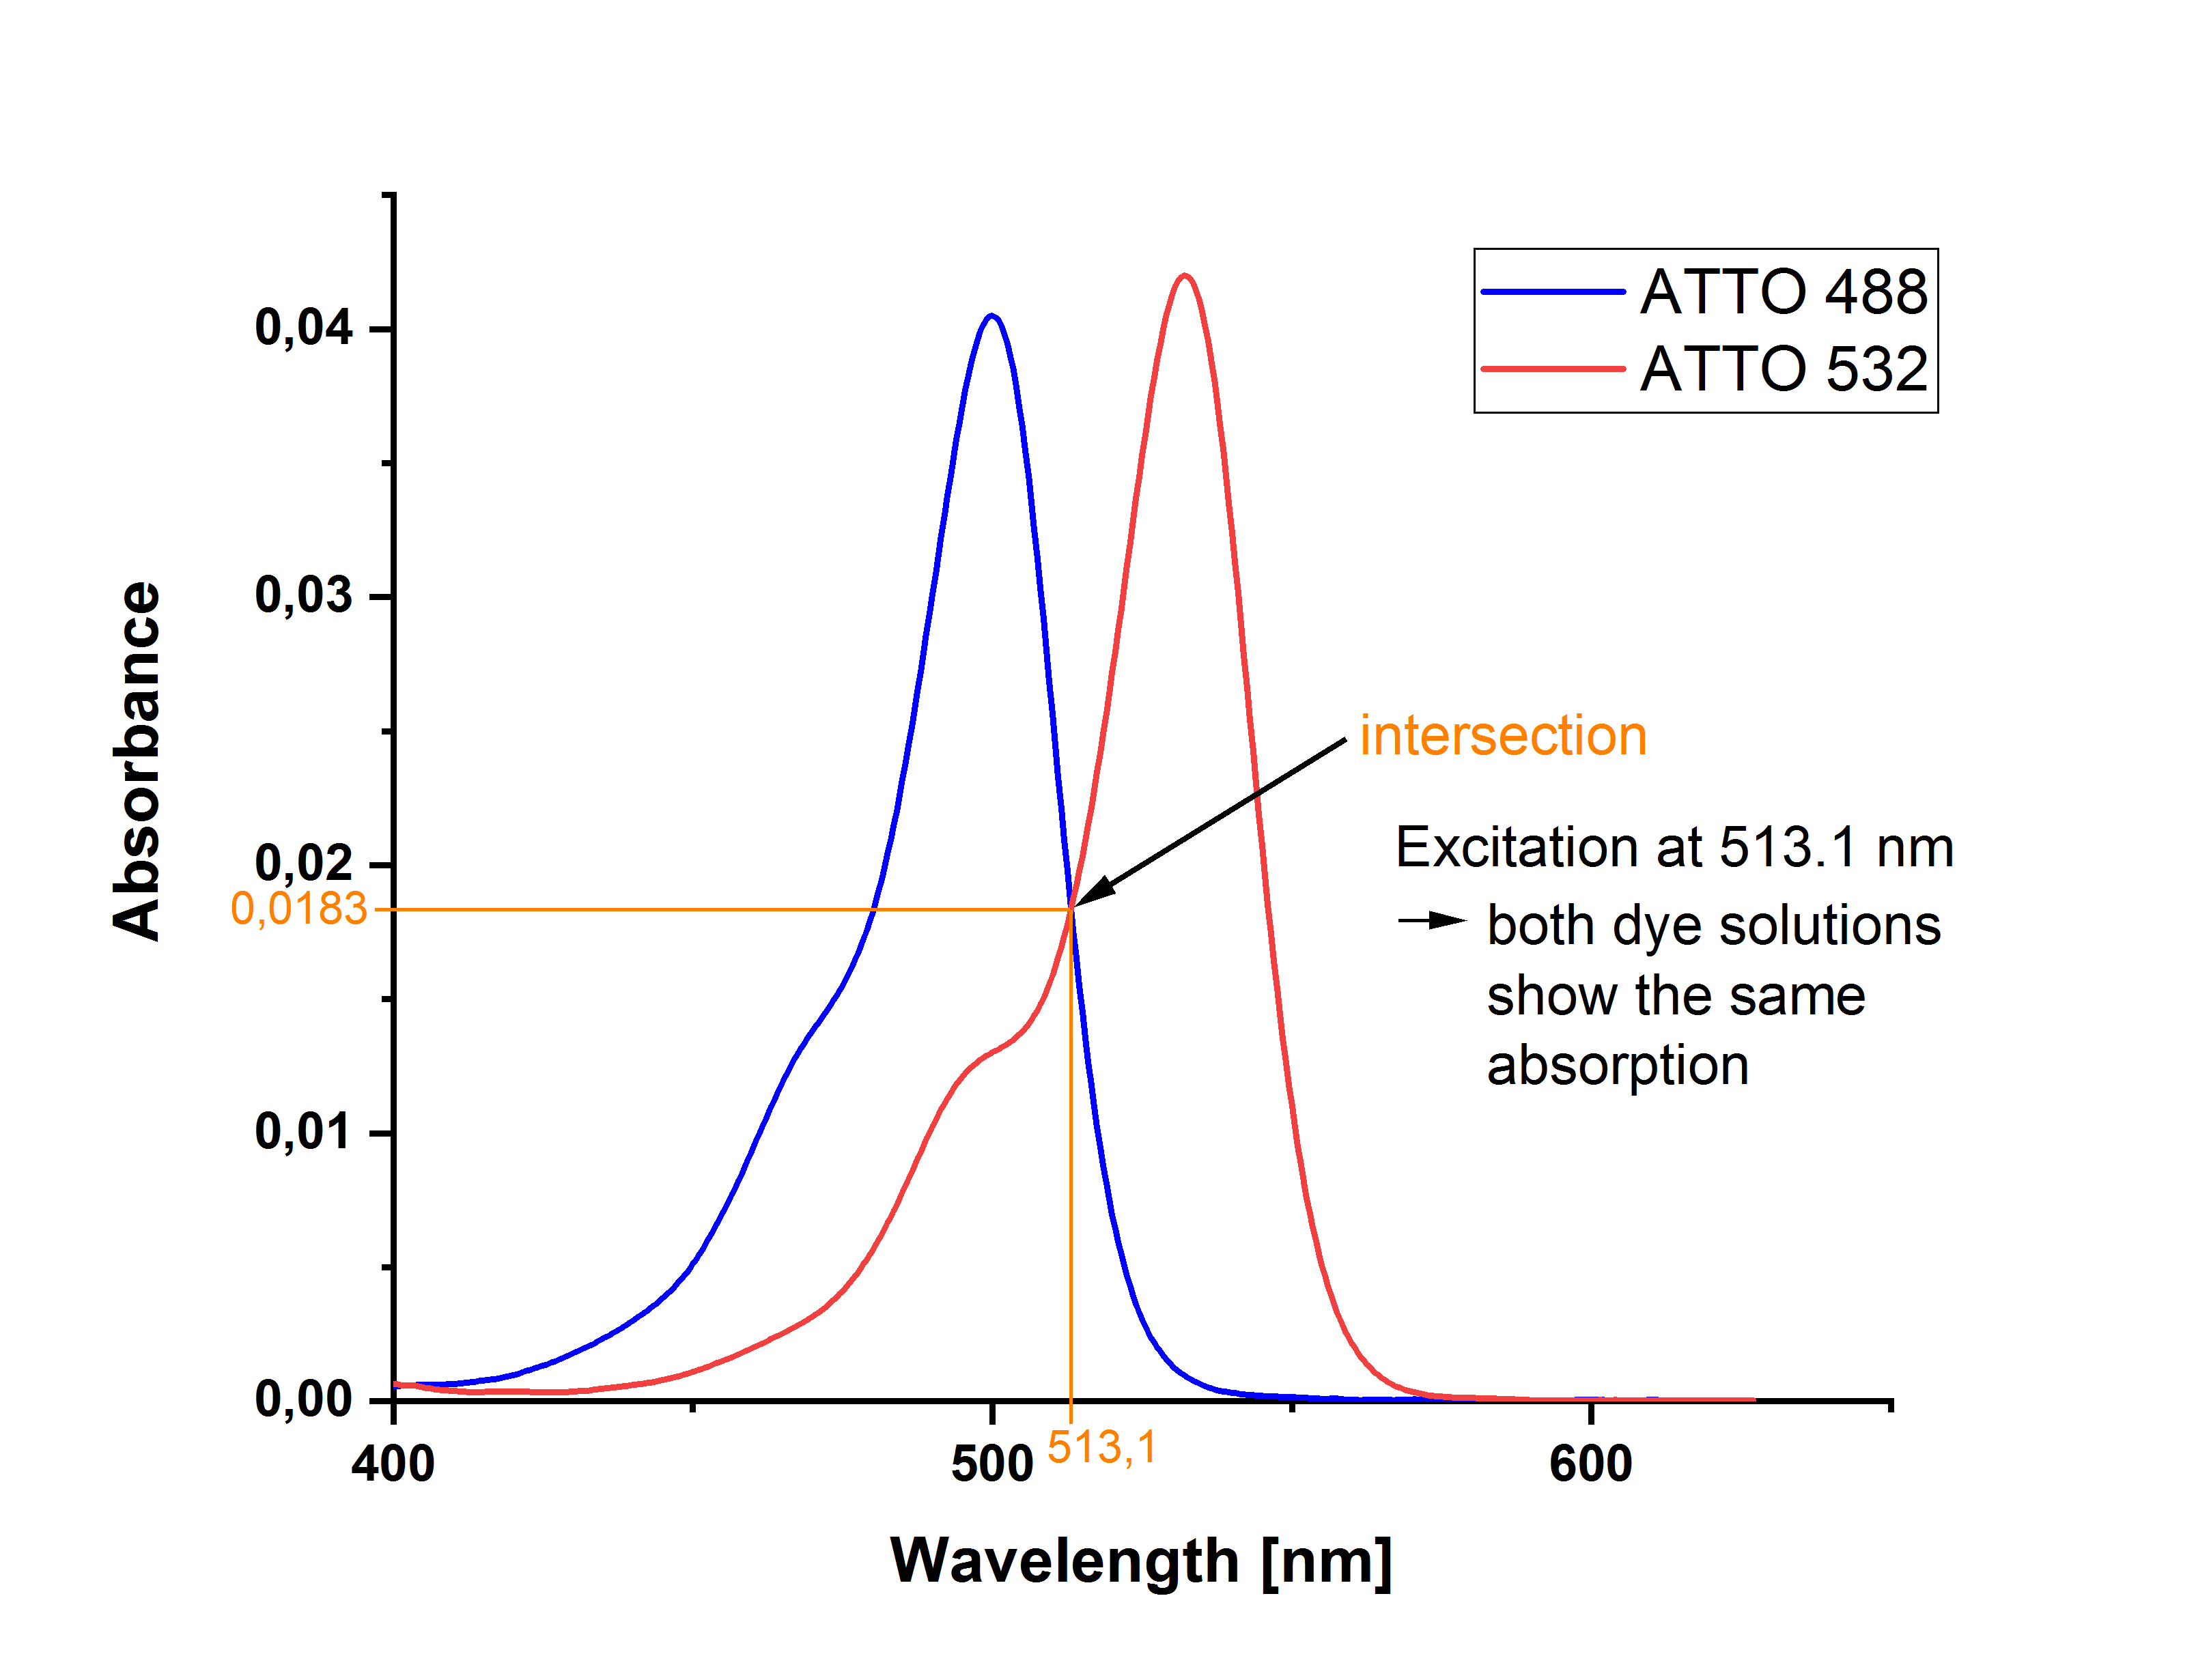
If, on the other hand, an excitation at the absorption maxima of sample and reference is chosen, both solutions must have exactly the same absorption at the respective wavelength. In the example shown ATTO 488 carboxy can be excited at 500 nm and ATTO 532 carboxy at 532 nm respectively; both solutions have an absorbance of 0.0420.
In this case, a corresponding correction of the different excitation intensity at the two excitation wavelengths must be performed during the fluorescence measurement. In modern fluorescence spectrometers, this wavelength-dependent intensity difference is determined by a standard photodiode, which also measures temporal intensity fluctuations of the excitation light source. This correction must be activated during the measurement via the instrument software, since it is no longer possible at a later time.
In addition, the selected measurement range should cover the entire fluorescence spectrum, i.e. the measured intensity in the long-wave flank should have dropped almost to the detector noise level.
Even if all these prerequisites are fulfilled, exact determinations of fluorescence quantum yields are very demanding in practice and require good preparation and careful execution of the measurement.
Notes on quantum yield measurement and possible sources of error
Many manufacturers nowadays provide their fluorescence spectrometers with precise working instructions for measuring the fluorescence quantum yield, which can also be downloaded from the respective website. Detailed information and notes on the corresponding instrument settings and measurement parameters can often also be found here. In addition, official efforts are also being made to develop methods and procedures for fluorescence standards.
The fluorescence spectra provided were measured with a fluorescence spectrometer Fluorolog 3 from HORIBA Jobin Yvon. For all ATTO-dyes the respective carboxy derivative in aqueous solution (PBS, pH 7.4) at 22 °C was used. The measurements were carried out in the 90 ° arrangement with horizontal polarization of excitation and emission. For the determination of the fluorescence quantum yield of the ATTO-dyes, fluorophores with precisely determined fluorescence quantum yield were used as reference dyes, e.g. rhodamine 6G, rhodamine 630 etc.
General information on fluorescence spectroscopy
Absorption spectrometers almost exclusively use two-beam instruments in which the sample solution and a reference (e.g. cuvette with pure solvent) are measured "simultaneously". This eliminates the so-called instrument characteristic from the spectrum obtained, which is given for differently polarized light and the specific detector characteristic due to different transmission of the monochromators (grating, slit) and reflection at the mirrors.
Since such a reference beam path is in principle not present in fluorescence spectroscopy, the different instrument characteristics for each fluorescence spectrometer must be corrected in a different way depending on the optical components and the light path in order to obtain the "true" fluorescence spectrum of a sample.
With modern fluorescence spectrometers, the control and evaluation software usually contains a so-called correction function for this purpose, with which the measured instrument spectra can be corrected either directly during the measurement or by the subsequent instruction of the user. The manufacturer creates this correction function, for example, by comparing the emission spectrum of a calibrated lamp measured with the device in question with the actual emission spectrum.
Apart from this, there is another phenomenon that should be taken into account in every fluorescence measurement. This is fluorescence polarization: Only if the fluorophores can move freely in the medium during the lifetime of the excited state unpolarized fluorescence can be obtained. In this case, the horizontal and vertical polarized fluorescence are equal.
Free mobility is influenced by the temperature-dependent viscosity of the solvent and the molecular volume.
In low viscosity solvents such as acetone, methanol, ethanol and water such polarization effects usually play only a minor role for small organic fluorophores with a lifetime in the nanosecond range at room temperature measurements.
However, if the fluorescence of the sample and/or reference is no longer unpolarized or even differently polarized due to strongly different molecular dimensions and/or fluorescence lifetimes, this can lead to falsification of the measured fluorescence spectra and thus to a wrongly calculated quantum yield.
To determine the fluorescence polarization of the solution of a fluorophore there is a relatively simple method, which can be found with its theoretical derivation and explanation in J.R. Lakowicz, Principles of Fluorescence Spectroscopy, 3rd Edition, Springer Science+Business Media, New York (2006).
An investigation of the fluorescence polarization of fluorescence markers coupled to macromolecules (polymers, proteins, DNA, etc.) whose free mobility is restricted or even inhibited during the lifetime of their excited state can - in interaction with the FRET technique - provide important insights into the molecular structure (geometry, distance, orientation) and associated dynamic phenomena.
Literature:
J. H. Brannon, D. Magde, Absolute Quantum Yield Determination by Thermal Blooming. Fluorescein, J. Phys. Chem. 82 705 (1978).
A.T.R. Willams, S.A. Winfiled, J.N. Miller, Relative Fluorescence Quantum Yields Using a Computer-controlled Lumniscence Spectrometer, Analyst 108, 1067 (1983).
J.R. Lakowicz, Principles of Fluorescence Spectroscopy, 3rd Edition, Springer Science+Business Media, New York (2006).
„A Guide to Recording Fluorescence Quantum Yields“, http://www.horiba.com/scientific
/products/fluorescence-spectroscopy/application-notes/quantum-yields/ (aufgerufen am 01.09.2017).
U. Resch-Genger, P.C. DeRose, Fluorescence standards: Classification, terminology, and recommendations on their selection, use, and production (IUPAC Technical Report), Pure Appl. Chem. 82, 2315 (2010).
The quantum yield depends intrinsically on the molecular structure of the dye, but is also influenced by numerous external factors. These include the temperature, viscosity, polarity and pH value of the environment. This environment can consist of molecules of the solvent itself or other jointly dissolved substances, but also of a coupled biomolecule or a cell membrane in whose immediate vicinity the fluorescent dye is located. By changing the fluorescence, conclusions can be drawn about certain properties of the environment: The fluorescent dye then acts as a molecular probe.
The fluorescence quantum yield is defined as the ratio of the number of photons (= light quanta) emitted as fluorescence and the number of photons previously absorbed by the sample:
If all absorbed photons are emitted as fluorescence, a quantum yield of 1 or 100 % is obtained. However, radiation-free deactivation processes of the excited state always compete with the emission, so that part of the absorbed energy is released into the environment as heat.
Exactly this phenomenon is used for the absolute determination of the quantum yield using "calorimetric" methods such as the Thermal Blooming method. This requires relatively complicated experimental set-ups as well as a comprehensive theoretical understanding for the conception and evaluation of the measurements.
It is easier to determine the unknown quantum yield of a fluorophore (sample) by comparing it with the known quantum yield of a standard or reference dye (reference) in a fluorescence spectrometer. This so-called relative determination can be performed in different ways:
- Comparison of the sample with a reference dye in a single measurement
- Comparison of the sample with several reference dyes in several single measurements
- Comparison of the sample with a reference dye at different concentrations and subsequent evaluation of the measured values obtained.
The statistical accuracy of the result increases with the number of comparison measurements performed.
The theoretical prerequisite for the application of the relative method is that the two solutions of sample and reference to be compared have an identical absorption at the excitation wavelength and thus absorb the same number of photons. Then the quotient of the integrated fluorescence spectra (IF = area of the fluorescence band) of both solutions - registered under identical conditions - gives the ratio of the quantum yields of both dyes, so that the unknown quantum yield can easily be calculated:
The following example illustrates the importance to record the entire fluorescence spectrum - the integral fluorescence intensity - for the determination of the fluorescence quantum yield with this method:
The dyes ATTO 488 carboxy and ATTO 430LS carboxy were both excited at the intersection of their absorption spectra and the emission of both solutions was measured. Comparative measurements with a standard (Rhodamin 6G) resulted in a fluorescence quantum yield of 80 % for ATTO 488 carboxy. With this, a value of 65 % is obtained for ATTO 430LS carboxy according to the described relative method. If only the intensity at the respective fluorescence maxima were taken into account, a value of 33 % for ATTO 430LS carboxy would be found compared to the known 80 % for ATTO 488 carboxy. This strong difference is due to the different spectral distribution of the fluorescence of the two dyes.
Identical conditions for recording the fluorescence spectra of sample and reference can be achieved from the instrument side by using the same measurement parameters. These include the geometry of the beam path (e.g. 90° or front face arrangement), detector gain, slit width (or bandpass) and the same excitation wavelength.
The excitation wavelength can, for example, be the intersection of the long-wave absorption bands of the sample and the reference. The absorption at the respective maximum of the dye band may then be slightly different.
This becomes clear with the example of ATTO 488 carboxy and ATTO 532 carboxy with slightly different absorbance at the individual absorption maxima: After recording absorption spectra of both measuring solutions, the intersection point (here 513.1 nm) at which both solutions have the same absorbance (here 0.0183) can be determined by superimposing the two spectra. (For small values extinction/absorbance and absorption are identical.)
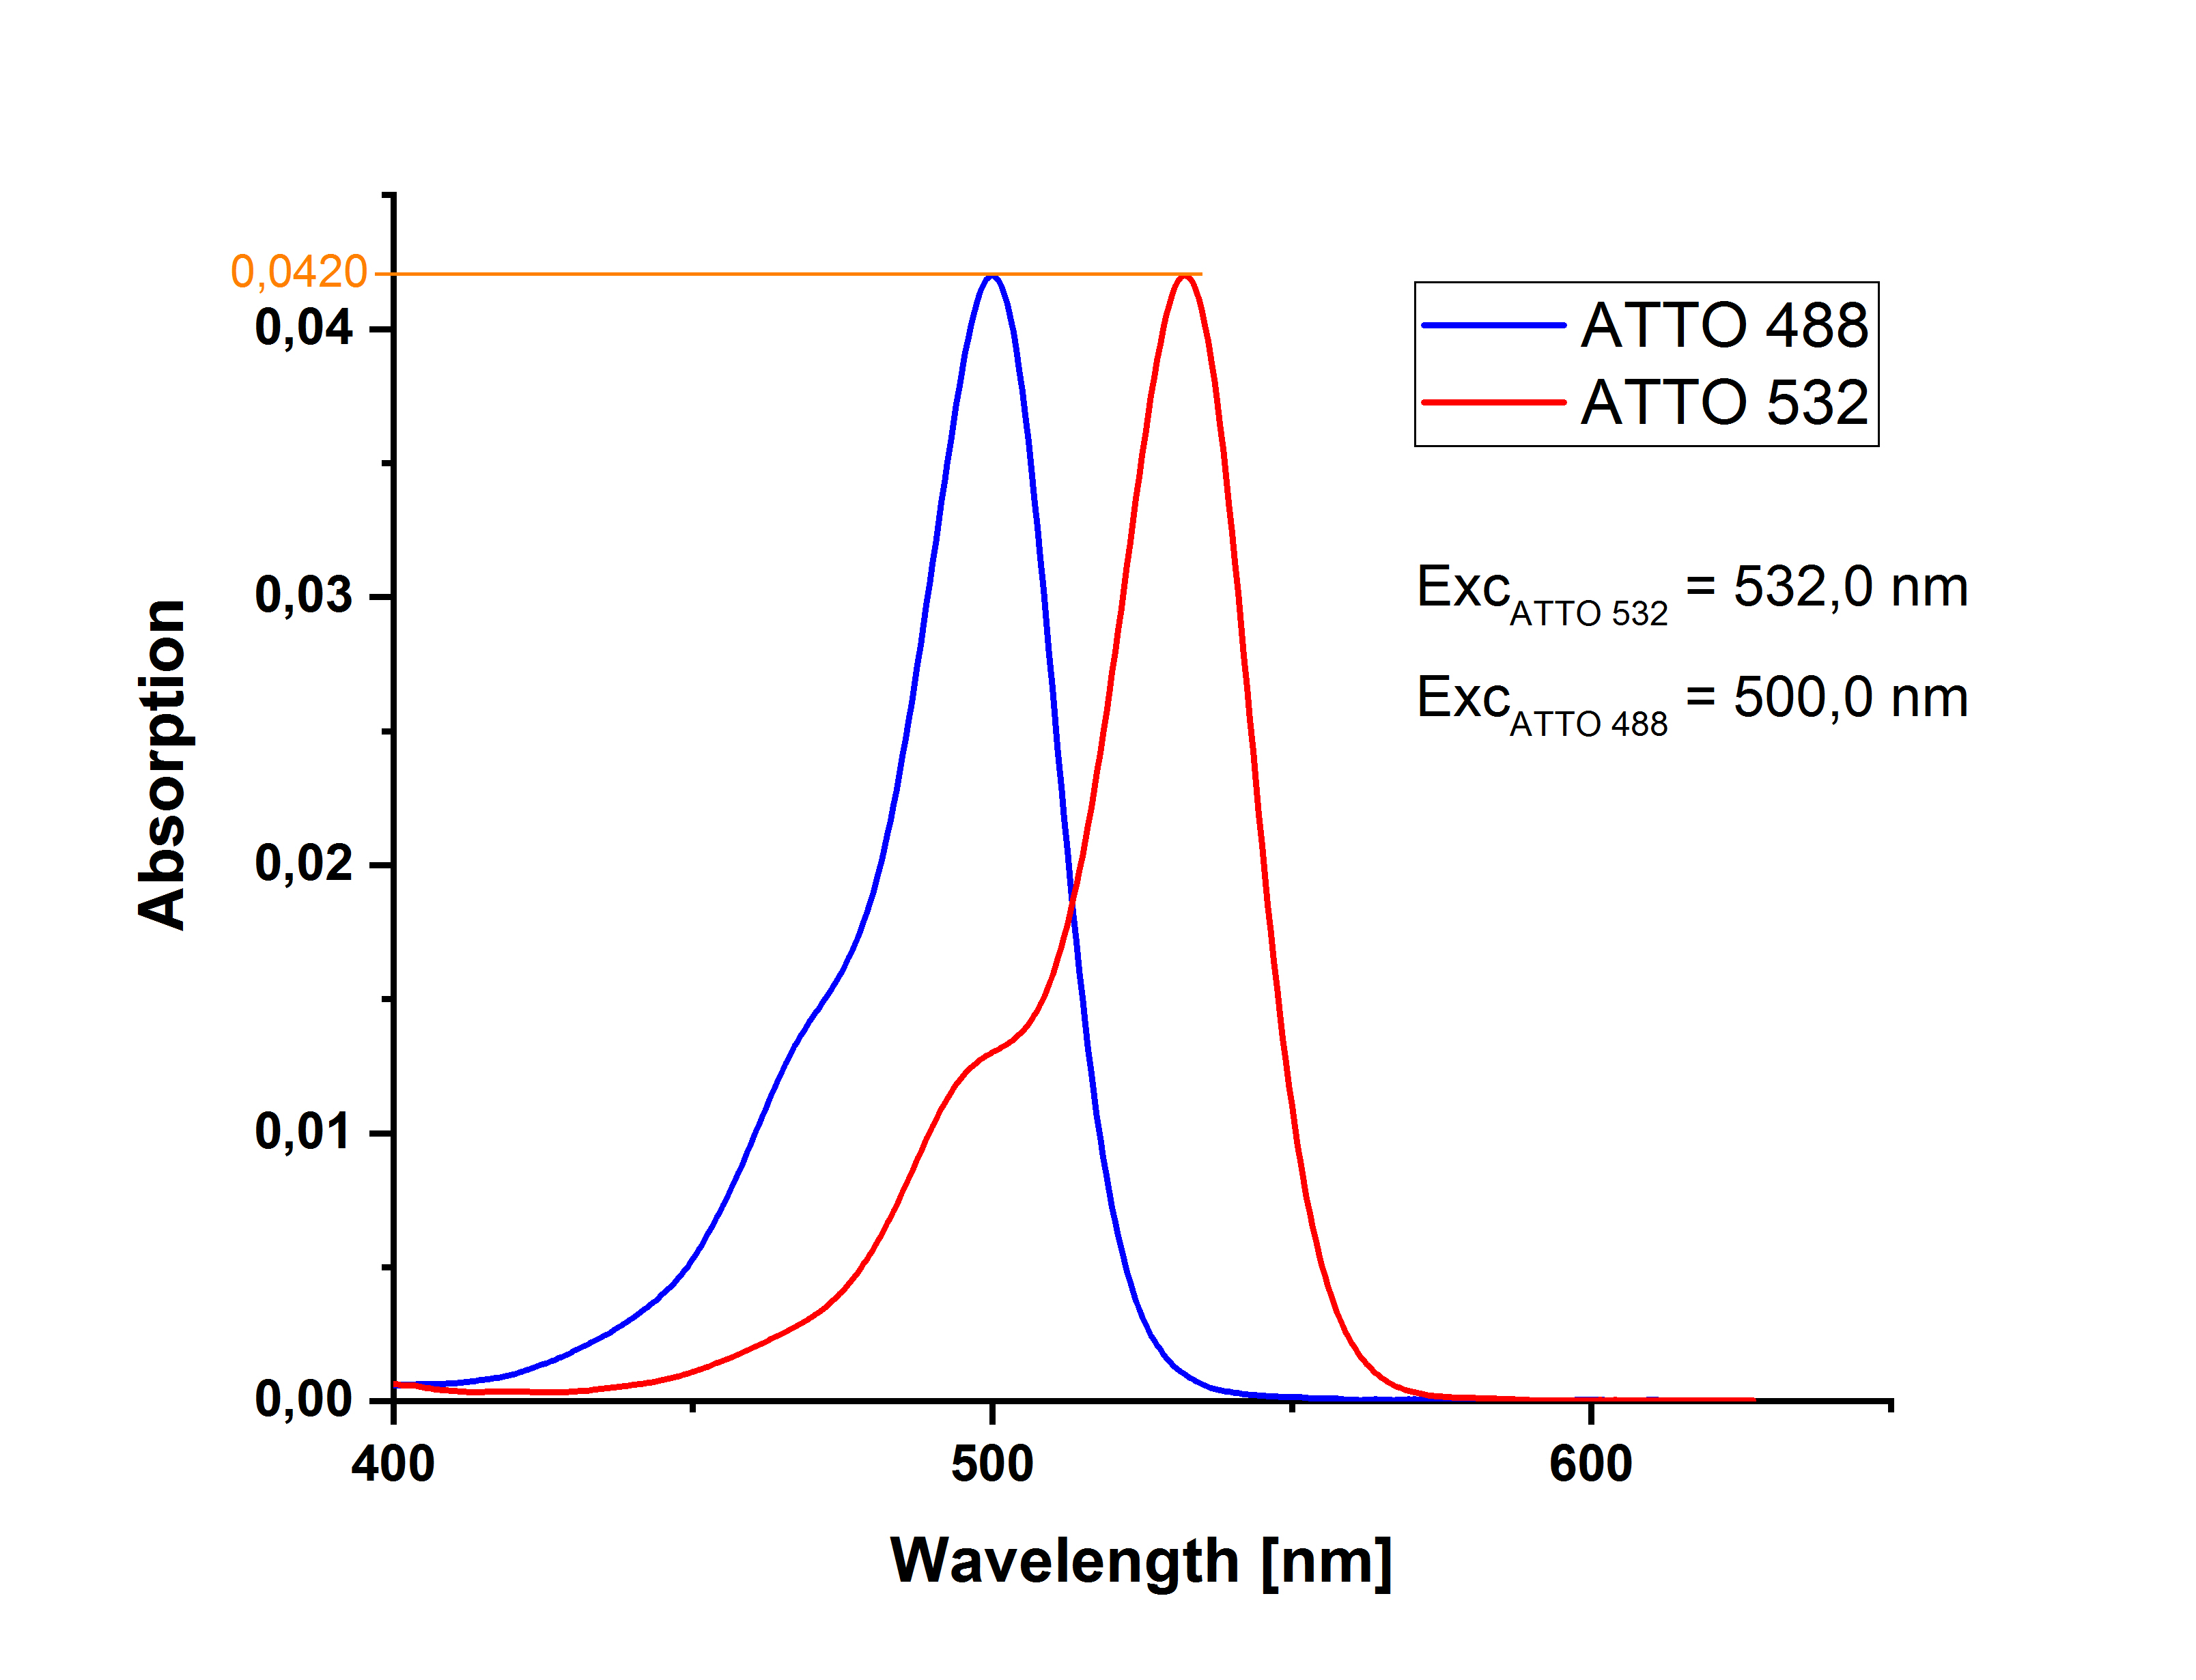
If, on the other hand, an excitation at the absorption maxima of sample and reference is chosen, both solutions must have exactly the same absorption at the respective wavelength. In the example shown ATTO 488 carboxy can be excited at 500 nm and ATTO 532 carboxy at 532 nm respectively; both solutions have an absorbance of 0.0420.
In this case, a corresponding correction of the different excitation intensity at the two excitation wavelengths must be performed during the fluorescence measurement. In modern fluorescence spectrometers, this wavelength-dependent intensity difference is determined by a standard photodiode, which also measures temporal intensity fluctuations of the excitation light source. This correction must be activated during the measurement via the instrument software, since it is no longer possible at a later time.
In addition, the selected measurement range should cover the entire fluorescence spectrum, i.e. the measured intensity in the long-wave flank should have dropped almost to the detector noise level.
Even if all these prerequisites are fulfilled, exact determinations of fluorescence quantum yields are very demanding in practice and require good preparation and careful execution of the measurement.
Notes on quantum yield measurement and possible sources of error
- The reference dye must be suitable and its quantum yield sufficiently well known. This can be verified, for example, by comparison with another reference.
- The reference dye should be selected so that it absorbs in the same range, i.e. can be excited, as the sample. Ideally, the two absorption spectra overlap and it can be excited during the fluorescence measurement at the intersection of both bands.
- All glassware and cuvettes must be kept absolutely clean.
- The solvents used should have the specification "for spectroscopy" and should be examined for their self-fluorescence.
- If, for example, different solvents are to be used for sample and reference due to differences in solubility, this must be taken into account by including the two refractive indices n in the calculation:
- Standard fluorescence cells with an optical path length of 10 mm should be used for fluorescence measurements.
- To reduce the occurrence of reabsorption effects, the absorbance in a 10 mm cell should not exceed 0.05. At higher concentrations, so-called internal filter effects can occur which strongly falsify the fluorescence measurement:
On the one hand, the excitation light no longer penetrates deep enough into the solution, which can lead to a reduced excitation of the sample in the center of the cuvette.
On the other hand, the fluorescence emitted from there is partially (re-)absorbed by other fluorophores in the beam path as it passes through the solution before it can leave the cuvette. The result is a fluorescence spectrum cut off in the short-wave range. - It must be ensured that the baseline of the absorption measurement is not falsified by light scattering on undissolved particles or dirty cuvette windows. Such scattering phenomena also interfere with fluorescence measurement, since scattered light from particles in the solution or on the surface of the cuvette can reach the detector. For this reason, the solvents and solutions used should be µ-filtered before measurement and the cuvette windows wiped from the outside with a lint-free cloth. Attention: Fingerprints!
- The measurement parameters of the fluorescence measurement (gain, slit width) must be adapted to the intensity of the fluorescence so that the detector used (e.g. photomultiplier) is not damaged by too much light. The measurement must take place in the linear range of the detector, because only then is the measured light intensity proportional to the incident light intensity.
- One should be aware of the influence of temperature on the measurement results.
Many manufacturers nowadays provide their fluorescence spectrometers with precise working instructions for measuring the fluorescence quantum yield, which can also be downloaded from the respective website. Detailed information and notes on the corresponding instrument settings and measurement parameters can often also be found here. In addition, official efforts are also being made to develop methods and procedures for fluorescence standards.
The fluorescence spectra provided were measured with a fluorescence spectrometer Fluorolog 3 from HORIBA Jobin Yvon. For all ATTO-dyes the respective carboxy derivative in aqueous solution (PBS, pH 7.4) at 22 °C was used. The measurements were carried out in the 90 ° arrangement with horizontal polarization of excitation and emission. For the determination of the fluorescence quantum yield of the ATTO-dyes, fluorophores with precisely determined fluorescence quantum yield were used as reference dyes, e.g. rhodamine 6G, rhodamine 630 etc.
General information on fluorescence spectroscopy
Absorption spectrometers almost exclusively use two-beam instruments in which the sample solution and a reference (e.g. cuvette with pure solvent) are measured "simultaneously". This eliminates the so-called instrument characteristic from the spectrum obtained, which is given for differently polarized light and the specific detector characteristic due to different transmission of the monochromators (grating, slit) and reflection at the mirrors.
Since such a reference beam path is in principle not present in fluorescence spectroscopy, the different instrument characteristics for each fluorescence spectrometer must be corrected in a different way depending on the optical components and the light path in order to obtain the "true" fluorescence spectrum of a sample.
With modern fluorescence spectrometers, the control and evaluation software usually contains a so-called correction function for this purpose, with which the measured instrument spectra can be corrected either directly during the measurement or by the subsequent instruction of the user. The manufacturer creates this correction function, for example, by comparing the emission spectrum of a calibrated lamp measured with the device in question with the actual emission spectrum.
Apart from this, there is another phenomenon that should be taken into account in every fluorescence measurement. This is fluorescence polarization: Only if the fluorophores can move freely in the medium during the lifetime of the excited state unpolarized fluorescence can be obtained. In this case, the horizontal and vertical polarized fluorescence are equal.
Free mobility is influenced by the temperature-dependent viscosity of the solvent and the molecular volume.
In low viscosity solvents such as acetone, methanol, ethanol and water such polarization effects usually play only a minor role for small organic fluorophores with a lifetime in the nanosecond range at room temperature measurements.
However, if the fluorescence of the sample and/or reference is no longer unpolarized or even differently polarized due to strongly different molecular dimensions and/or fluorescence lifetimes, this can lead to falsification of the measured fluorescence spectra and thus to a wrongly calculated quantum yield.
To determine the fluorescence polarization of the solution of a fluorophore there is a relatively simple method, which can be found with its theoretical derivation and explanation in J.R. Lakowicz, Principles of Fluorescence Spectroscopy, 3rd Edition, Springer Science+Business Media, New York (2006).
An investigation of the fluorescence polarization of fluorescence markers coupled to macromolecules (polymers, proteins, DNA, etc.) whose free mobility is restricted or even inhibited during the lifetime of their excited state can - in interaction with the FRET technique - provide important insights into the molecular structure (geometry, distance, orientation) and associated dynamic phenomena.
Literature:
J. H. Brannon, D. Magde, Absolute Quantum Yield Determination by Thermal Blooming. Fluorescein, J. Phys. Chem. 82 705 (1978).
A.T.R. Willams, S.A. Winfiled, J.N. Miller, Relative Fluorescence Quantum Yields Using a Computer-controlled Lumniscence Spectrometer, Analyst 108, 1067 (1983).
J.R. Lakowicz, Principles of Fluorescence Spectroscopy, 3rd Edition, Springer Science+Business Media, New York (2006).
„A Guide to Recording Fluorescence Quantum Yields“, http://www.horiba.com/scientific
/products/fluorescence-spectroscopy/application-notes/quantum-yields/ (aufgerufen am 01.09.2017).
U. Resch-Genger, P.C. DeRose, Fluorescence standards: Classification, terminology, and recommendations on their selection, use, and production (IUPAC Technical Report), Pure Appl. Chem. 82, 2315 (2010).